WaBis
walter.bislins.ch
Can we see the Oblateness of the Earth on Satellite Images?


 Deutsch: Können wir die Abplattung der Erde in Satellitenbildern sehen?
Shape of the Earth: Ellispoid
If the earth would not rotate, gravity would form the earth to a perfect sphere. The rotation around the north-south axes causes centrifugal forces perpendicular to the rotation axes outward. Because the earth is mostly liquid under the crust, it can be deformed by this forces, building a slight bulge around the equator. Some people call this Oblate-Spheroid. The technical term is Ellipsoid.
Geodetic measurements reveal that the diameter pol to pol is Dpol = 12,713.6 km and the diameter at the equator is Deq = 12,756.2 km. The earth is said to be 42.6 km wider than high. The ratio width / height is: Deq / Dpol = 1.00335.
Can we see this oblateness on satellite images from space? Lets find out.
Choosing good Satellite Images
There are many weather satellites in geostationary orbits around the earth. They stay at the same point over the equator, because they orbit at the same rate as the earth rotates. One of the newest is the Japanese weather satellite Himawari 9. It's image sensor has 11,000×11,000 pixel resolution, that is about 1 km/pixel. So this 42.6 km difference in the diameter should result in about 37 pixel difference in height. This should be measurable in a graphic software like Photoshop or Gimp.
There are some problems though: The earth is not always lit by the sun exactly from behind, one of the poles is usualy not lit by the sun. Ideally we have to find an image taken at equinox at a time where the sun is exactly behind the satellite. Another problem is that the atmosphere has no sharp edges and is itself about 50−100 km high. From RGB images it is difficult to find an edge that can be used to measure the diameters accurately.
But luckily weather satellites also take infrared images from the earth. In infrared imagages you can see unlit regions because the earth is emitting infrared radiation at night and day and the atmosphere itself is transparent. So we can get infrared images with sharp edges.
The infrared images of the Himawari 9 satellite have a resolution of 5500×5500 pixels. That still should get a good enough measurement of the difference in the diameters. Let's see:
I took the following infrared imgage from the japanese Himawari 9 weather satellite:


| Source | http://www.jma.go.jp/ |
| Image-Url | http://www.jma-net.go.jp/ |
| Band | 11 (8.6 µm) Infrared |
| Date | 24 Jan. 2017 |
| Size | 5500×5500 pixel |
| Website | Meteorological Satellites-Japan Meteorological Agency (JMA) First images from Himawari-9 Japan Meteorological Agency |
| Description |
At 02:40 UTC on 24 January 2017, the first images from all 16 bands were captured by JMA's Himawari-9 geostationary meteorological satellite, which was launched on 2 November 2016.
For more information: http://www.jma-net.go.jp/ |
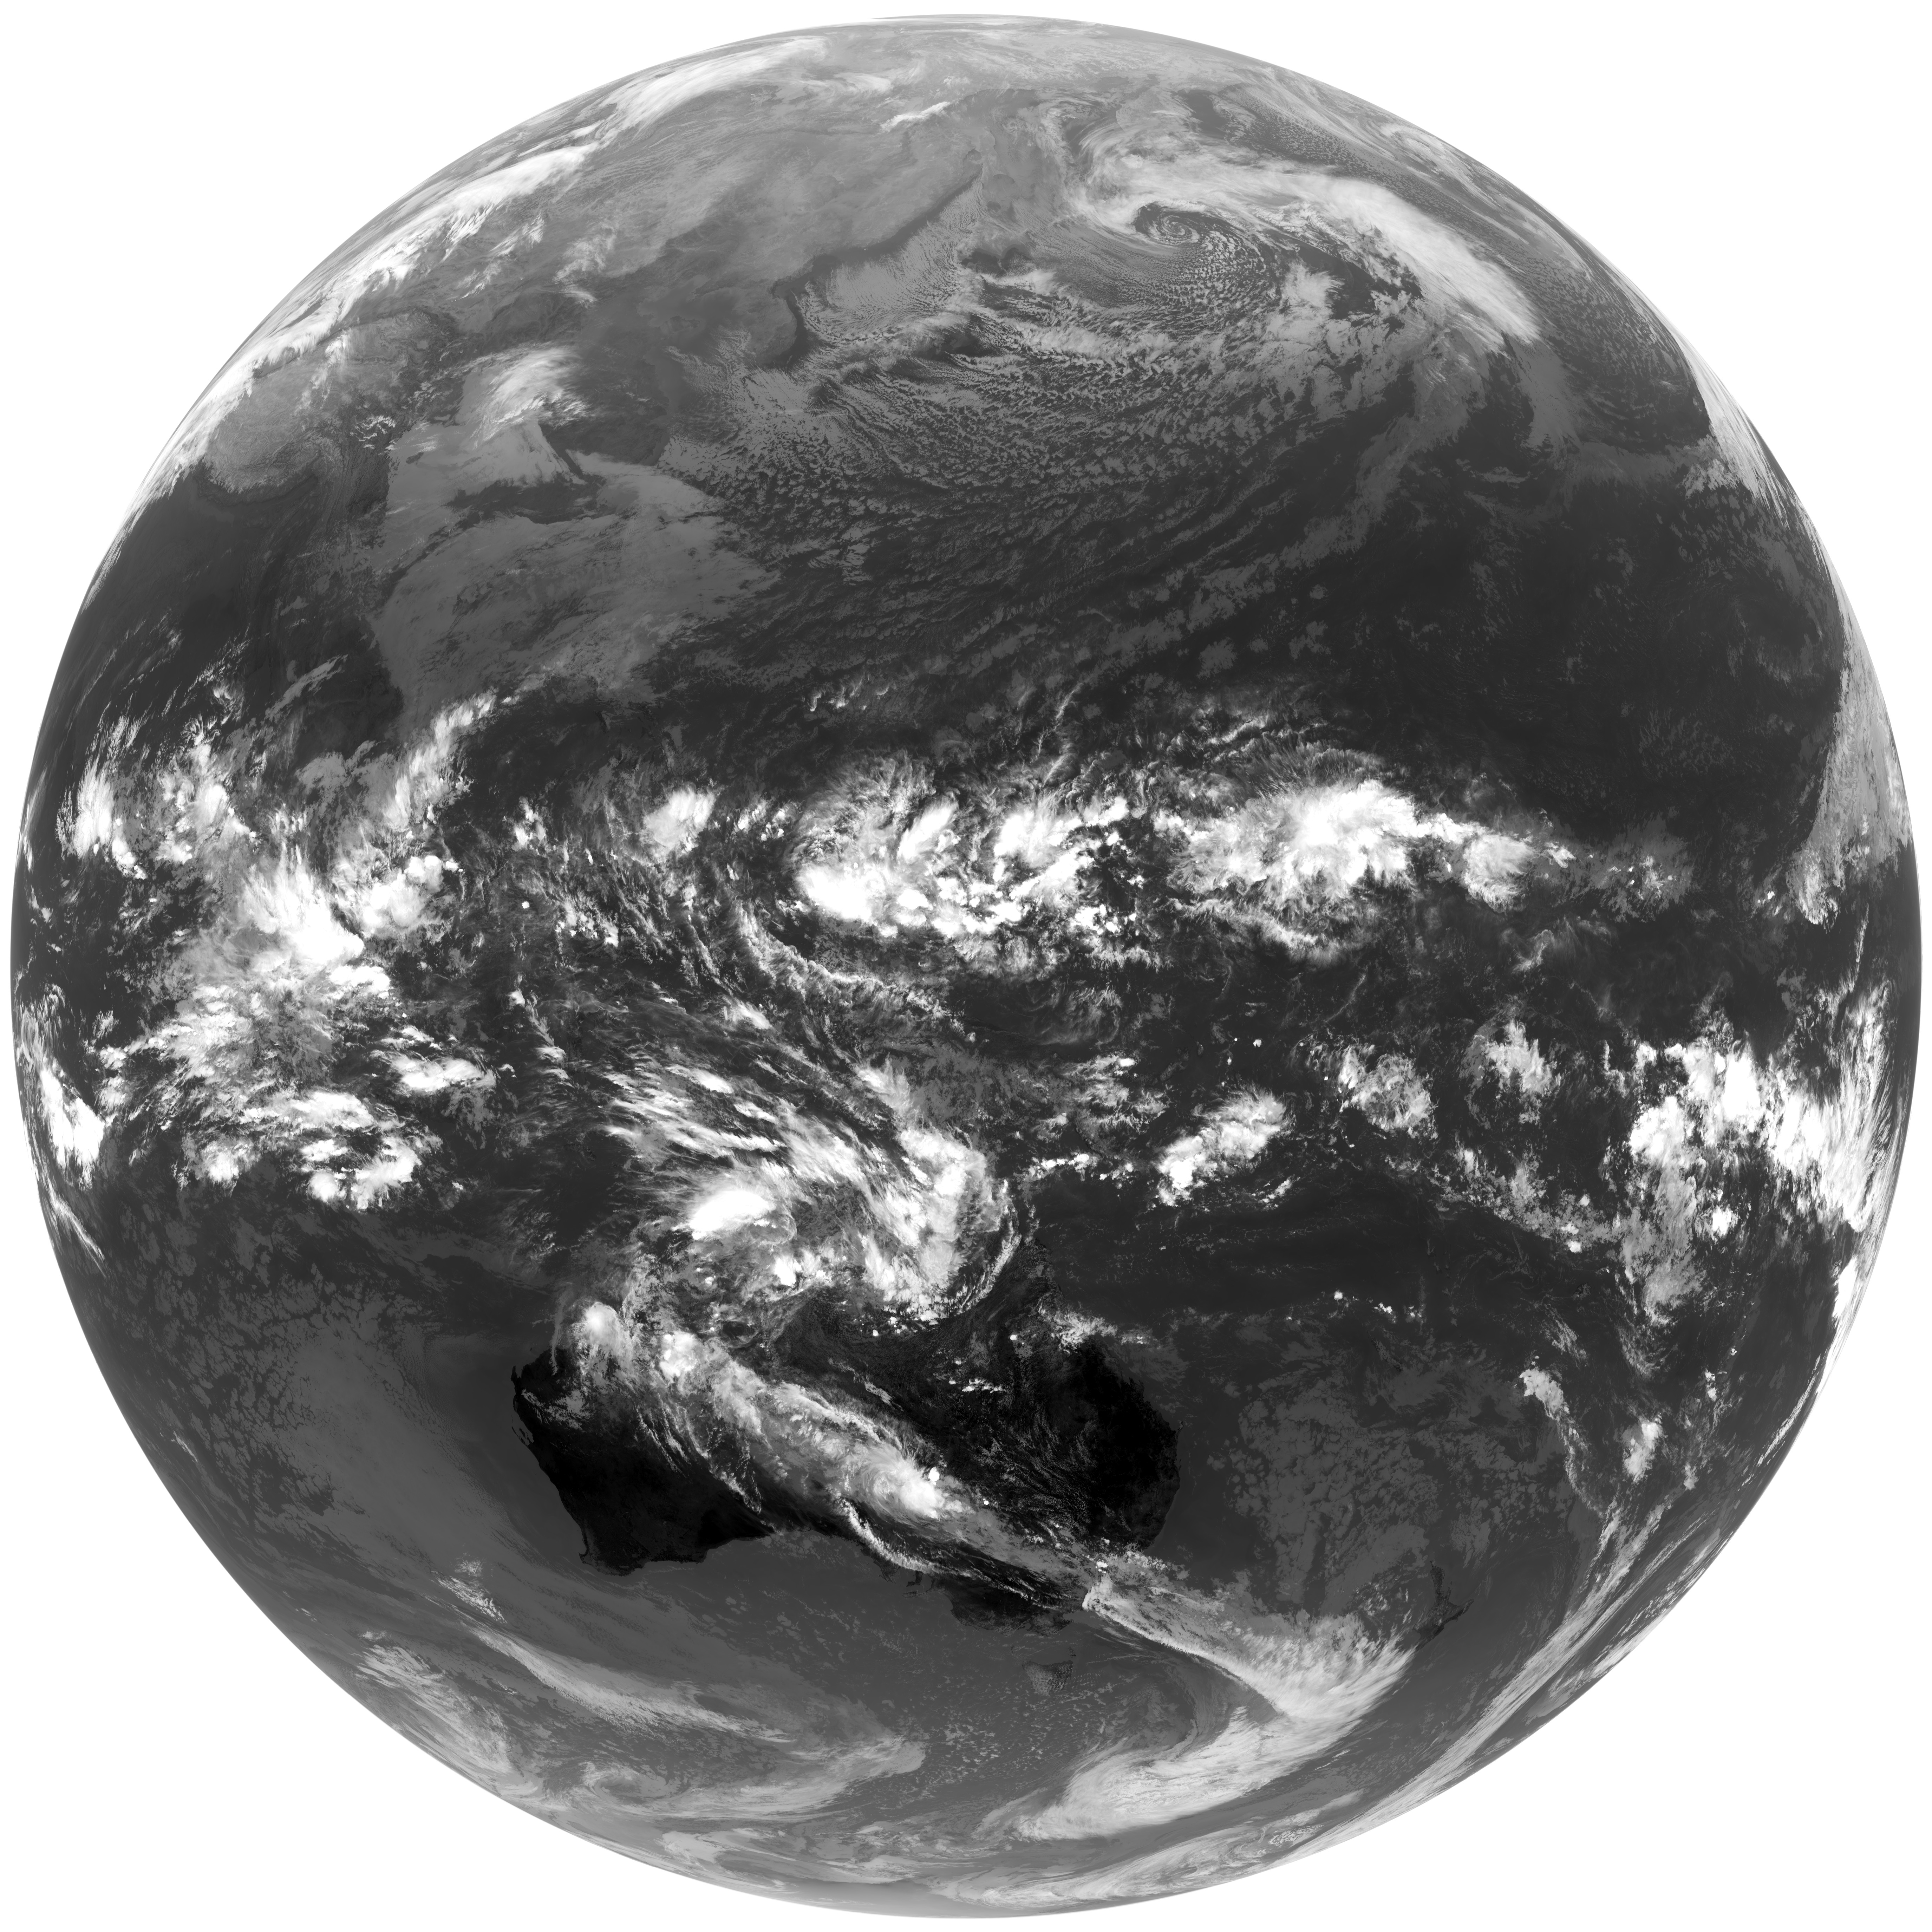
The image shown above is the cropped version of the original image. To check the cropping I made, click here to get the full sized cropped image in a separate window, from where you can download it. Then open it in a photo editor of your choice (Gimp, Photoshop etc.). Set the zoom factor to greater than one (eg 4) and see how the edges of the earth touch the border of the picture. Check the dimensions of the image by right clicking the downloaded image and clicking on Properties.

Result
I opened the original image in Gimp and cropped it, so that the edges of the earth touch the border of the image. Now the image dimensions should be proportional to the real dimension of the earth:
| Width of the cropped image | 5442±1 pixel |
| Height of the cropped image | 5422±1 pixel |
| Aspect ratio of the image | Width / Height = 1.00369±0.00037 |
| Aspect ratio of the earth | Deq / Dpol = 1.00335 |
We can see, that the high resolution images from satellites show the real shape accurately within the error margins of ± 1 pixel. The oblateness can be measured from this images and match the measured values from geodesy. But the oblateness is too small to be noticed by the naked eye.
Error margin estimation
We have a width w and a height h in pixels with an error margin of ±1 pixel and want to calculate the error margin of w / h. I show you how this is done:
First we express the variables with relative error margins εw and εh:
- w → w · (1 ± εw)
- h → h · (1 ± εh)
We compute the quotient w / h with error margins:
| (1) |
We need a method to compute εtot from εw and εh. First we bring the error margin in the denominator in the same form as the nominator:
| (2) |
Because εh is much smaller than 1, we get (1 ± εh) ≈ 1 and we can simplify to:
| (3) |
So our error estimation (1) looks now:
| (4) |
Multiplying the last 2 terms gives:
| (5) |
The product of εh · εw is always much smaller than each of the numbers, so its a good approximation to cancel them and we get:
| (6) | |
| where |
So when dividing 2 numbers with error margins, their error margins add up.
We can now estimate the error margins in our measurement:
- εw = εh = 1 / 5500, because w ≈ h ≈ 5500 · (1 ± 1/5500) = 5500 ± 1
- εtot = εw + εh = 2 / 5500
| (7) |
Summary: the oblateness of the earth as measured from the satellite image is equal the oblateness as measured by geodesy withing the error margins of ±1 pixel, see Result.
How strong is the Centrifugal Force compared with Gravity?
The earth rotates with a tangential speed at the equator of 1668 km/h! Should this not rip the earth apart?
The answer is no. The tangential speed is irrelevant. The cause of the oblateness of the earth is only the centrifugal acceleration. The centrifugal acceleration is small compared with the gravitational acceleration. Lets compute this accelerations and compare them:
The precise strength of Earth's gravity varies depending on location. The nominal "average" value at the Earth's surface, known as standard gravity is, by definition [1]: 9.80665 m/s2.
Gravity is an acceleration acting towards the center of the earth. Its magnitude depends on the mass of the earth and the distance from the center of the earth and can be computed as:
| (8) |
| ||||||||||||
| where' |
|
The centrifugal acceleration depends on the latitude, is 0 at the poles and maximum at the equator:
| (9) |
| |||||||||||||||
| where' |
|
At the equator the radius is R = 6378.1 km and cos(φ) = 1. The centrifugal acceleration at the equator is then:
| (10) |
|
So the maximum centrifugal acceleration at the equator is only 0.344 % of the mean gravitational acceleration. This causes only a very small bulge at the equator of 21.3 km.
Sources
http://physics.nist.gov/Pubs/SP330/sp330.pdf