WaBis
walter.bislins.ch
Rainy Lake Experiment: Refraction Measurements
Atmospheric Refraction
Refraction is a major factor when observing distant objects. Refraction changes the apparent vertical position with respect to a reference line like eye level. Because the Rainy Lake Experiment is about the relative vertical positions of targets, refraction has to be taken into account.
So lets talk about how refraction works and can be calculated:
Light travels at a slower speed in transparent media than in vacuum. [1] The amount of the slow-down is expressed with the index of refraction n = c/v, where v is the speed of light in the medium and c is the speed of light in vacuum. If light encounters a change in the index of refraction and the boundary of the change is not perpendicular to the direction of the light ray, the direction of the light ray changes at the boundary, always in the direction of the higher index of refraction. We can use Snell's law to calculate the angles of the light ray with respect to the perpendicular to the boundary layer.

The density of the atmosphere generally decreases exponentially with increasing altitude. The index of refraction is proportional to density. Because the density change is not abrupt but continuous, the light rays do not suddenly change direction, but are bent in an arc towards the denser part of the atmosphere, which is usually downwards. This is even the case for light rays that start perpendicular to the density gradient, i.e. horizontal in the atmosphere. This means that objects in the distance appear higher than with a straight line of sight, because the bent light rays of objects reach the observer from more above.

Refraction is not a constant phenomenon. It depends strongly on the current atmospheric conditions along the light path and therefore fluctuates on the way to the observer. Since it is difficult to measure the actual refraction from the object to the observer, an average value is obtained which can be calculated from the atmospheric conditions at the observer's location, at least for shorter distances of only some km. But these values can be used for longer distances too, if there are similar conditions along the light path. The average value corresponds to a light beam following an arc of constant radius RR.
Atmospheric refraction can be expressed with different values. Some are independent on the distance of the observed object, like the Refraction Coefficient and the Refraction Factor. Others, like the Refraction Angle and the Apparent Lift due to Refraction, depend on the distance to the object.
Refraction Coefficient
The refraction Coefficient k, often simply called refraction, is defined as the ratio of the mean radius of the earth R to the curvature radius of the bent light rays RR:
| (1) |
|
per Definition | |||||||||
| where' |
| ||||||||||
If the light rays are not curved, their radius RR is infinite. This means that for non-curved light rays the refraction Coefficient is k = 0. If the light rays follow the earth's curvature, which is quite possible, then k ≥ 1. In this case the earth appears flat or even concave, see Strong Refraction.
Note: The occurence of the radius of the earth in the refraction Coefficient definition has no influence on refraction itself. It is simply a convenient definition and works the same for any shape of the earth, because the only variable that depends on refraction is the radius of curvature of the light ray, not the shape of the earth.
Standard Refraction: On average the atmosphere has a certain pressure, temperature and density gradient. This average is called International Standard Atmosphere. On standard atmospheric conditions refraction is called Standard Refraction.
For Standard Refraction a value of k = 0.13 is often used in survey. Another frequently used value assumes a radius of curvature for light rays of RR = 7 · R, which corresponds to a refraction Coefficient of k = 0.14 or a Refraction Factor a = 7/6. The equation below gives a refraction Coefficient of k = 0.17 at sea level, decreasing with altitude.
The difference in the apparent lift of the observed object is small between the different values for Standard refraction between k = 0.13 and k = 0.17: for an altitude measurement of a target in a distance of 1000 m the difference in apparent lift is only about 3 mm while the drop due to earth's curvature is 78 mm. The apparent lift (looming) of a target at 1000 m at k = 0.17 is 13 mm, which is 1/6 of the curvature drop. Because the target appears 1/6 of the real drop loomed upwards to 65 mm apparent drop, we have to correct the measurement by multiplying it with 6/5 = 1.2 to get the real drop.
The refraction Coefficient can be calculated from air pressure, temperature and temperature gradient as follows:
| (2) |
| ||||||||||||
| source | |||||||||||||
| where' |
|
The refraction Coefficient decreases with increasing altitude due to a decrease in air pressure. Refraction is very sensitive to temperature gradients, i.e. small changes in temperature in the height range of the light ray. Near the surface refraction can change considerably if the surface temperature is different than the air above, which is almost always the case.
Above a surface that is cooler than the air (ice, water), you can get refraction Coefficients greater than k = 1 easily, which means that light rays follow the curvature of the earth for hundreds of km. Laser tests over water to prove the earth is flat are therefore flawed, because strong refraction causes the laser to bend along the surface to the observer, see Strong Refraction at Bedford Targets.
To get accurate measurements you have to assure that the line of sight is always some meters above the surface, the temperature of the surface and the air is about the same (no visible distortions, clear image) and the distance to the object is not too far, because the apparent lift due to refraction increases with the square of the distance.
Further usefull readings with explanations and simulations of refractions:
 Finding the curvature of the Earth)
Refraction Factor
In order to be able to use the same equations e.g. for the calculations of the obscuration of objects by the curvature of the earth and taking refraction into account, there is a trick: simply replace the radius of the earth R by an increased apparent radius of the earth R', which can be calculated from the refraction Coefficient k, and assume the light ray as straight. This does not change the geometry between the earth and the light ray.
I denote the multiplier as Refraction Factor a:
| (3) |
|
per Definition | ||||||||||||
| (4) |
|
| ||||||||||||
| where' |
| |||||||||||||
A value of a = 7/6 corresponds to Standard refraction k = 0.14.
Note: In the literature the refraction Factor is often denoted as K (big K). To avoid confusion with the refraction Coefficient k I use a instead of K.
The refraction Factor can be calculated from the refraction index gradient or refractivity gradient as follows:
| (5) |
| |||||||||||||||||||||
| source | ||||||||||||||||||||||
| where' |
|
Apparent Lift due to Refraction
Due to the fact that the density of the atmosphere decreases with increasing altitude, light rays get bent towards the surface of the earth. So light rays from a target reach an observer from more above than without refraction. The target appears higher than it is in reality. Refraction can vary a lot near the surface. If this is the case, images appear distorted and unsteady. If an image is calm and clear, then refraction of light rays, that do not pass near the surface, can be assumed to be bent according to standard of about k = 0.13..0.17.
If we know the mean refraction Coefficient k we can calculate how much each target appears to be lifted as measured at the target with the following equation:
| (6) |
| |
| (7) |
| |
| (8) |
| |
| source |
| where' |
|
Note: This equations can be used for any shape of the earth. The factor R is only present because the refraction Coefficient k is defined as the curvature of the light ray 1/RR times R. The curvature of the light ray itself is independent of the shape of the earth.
The following table lists the expected lifting for each target depending on some refraction coefficients.
| values in m | Target (1) | Target (2) | Target (3) | Target (4) | Target (5) | Target (6) | Target (7) |
|---|---|---|---|---|---|---|---|
| distance | 1095 | 2169 | 3234 | 4363 | 5434 | 6429 | 9459 |
| height | 1.82 | 1.84 4.27 | 1.81 | 1.84 5.24 | 1.73 | 1.67 6.50 | 10.54 |
| size | 0.55 | 0.37 0.41 | 0.55 | 0.74 0.86 | 0.92 | 0.65 0.65 | 1.6 |
| lift (k=0.1) | 0.01 | 0.04 | 0.08 | 0.15 | 0.23 | 0.32 | 0.70 |
| lift (k=0.17) | 0.02 | 0.06 | 0.14 | 0.25 | 0.39 | 0.55 | 1.19 |
| lift (k=0.27) | 0.03 | 0.10 | 0.22 | 0.40 | 0.63 | 0.88 | 1.90 |
| lift (k=0.41) | 0.04 | 0.15 | 0.34 | 0.61 | 0.95 | 1.33 | 2.88 |
As we can see the farther away a target is, the more it appears lifted by refraction. The last Tangent target (7) can easily appear lifted higher than its size even by moderate refraction changes, as shown at Strong Refraction at Tangent Targets.
Note: The Bedford target centers were set exactly 1.85 m above the lake water level. In the table above are the target center heights listed as used by the Computer Model . Due to variations in the gravitational field of the earth, expressed by the Earth Gravitational Model (EGM96 Geoid), see Obtaining Elevations, the Ellipsoid height of the lake surface at the last target (7) is about 25 cm lower than the Ellipsoid height of the lake surface at the observer. The Computer Model does not take the Geoid variations into account. To simulate the exact geometrical 3D positions of the targets, all target center heights were adjusted for a perfect sphere by using the Ellipsoid heights of the targets with respect to the Ellipsoid height at the observer. This results in the reduced target center heights shown in the table above. Using this adjustments the target images of the Computer Model match the observations perfectly, while the horizon appears about 24 cm too height on the Computer Model, because it does not model the surface drop of 25.1 cm of the Geoid.

Horizon above Eye Level
If refraction causes the horizon to appear above eye level (concave earth), the horizon will be as far away as we can see, if there are no obstructions. The ground will fade slowly into the sky and therefore the horizon is not a distinct line. Note, there will always be a horizon, because there are always light rays that never reach the ground. At refractions k < 1, including Standard refraction, the Globe has a distinct horizon at a certain distance, see equation Line of Sight Distance to Horizon. The Flat Earth on the other hand only has a distinct horizon when light is bent upwards due to negative refraction.
Below are 2 images from a Refraction Simulation that show how the horizon will appear at Standard refraction for the Globe and the Flat Earth model. The simulation predicts that on the Flat Earth there is no distinct horizon line like on the Globe, if refraction is greater than 0. To clearly see this effect in reality you have to strongly zoom in on the horizon.

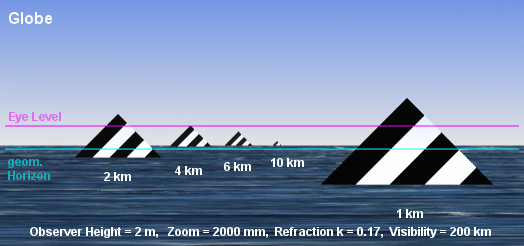 Distinct horizon on the Globe model
 No distinct horizon on the Flat Earth model
The targets are 3 m high and 6 m wide.
Refracted Light Rays on Globe and Flat Earth
The curvature of the light rays due to terrestrial refraction practically does not depend on the shape of the earth, but is only a function of the density gradient. This in turn is related to the pressure and temperature gradients via the ideal gas law. These gradients have nothing to do with the shape of the earth, just the gravitation and the composition of the atmosphere.

In this Simulation of Atmospheric Refraction we can see that the light rays bend exactly the same amount on Globe and Flat Earth model. The only difference is that we see the horizon at different vertical angles with respect to eye level. The apparent lift of the horizon or any object is practically identical in both models. The fact that the air layers are curved on the Globe but flat on the Flat Earth has no effect on distances much smaller than the radius of the earth.

Note: This is not true if we measure in layers near the ground and have strong refractions in this layers causing mirages and compressions. [2] In this case Globe and Flat Earth do not look the same at the same atmospheric conditions. We can use the Simulation of Atmospheric Refraction to investigate such behaviour. But if we observe objects above such layers from above such layers the difference is negligible.

Refraktion in the Flat Earth Model
In order to get the observations on a flat earth, the refraction would have to be very strong and negative, so that the light is permanently curved upwards at any height. Such refractions require temperature gradients of −15°C per 100 m up to the flat earth dome, see Simulation of Atmospheric Refraction.
This is physically impossible. Negative refraction can only occur in thin layers above the surface with temperature inversions and creates mirages and highly distorted images.
The refraction of the atmosphere is predominantly positive and bends the light downwards, see Refraction Coefficient as a Function of Altitude. Positive refraction makes the earth appear flatter than it is and can bring objects into view that are expected to be obscured by the curvature of the earth at zero refraction.
The superimposition of images of the observations with the measured GPS vectors shows that the apparent lift of the targets agrees with the calculations using standard to moderate refraction.
 For all we know about atmospheric physics, the observations made are impossible on a flat earth.
Measuring Refraction
There are two methods used to measure refraction in the Rainy Lake Experiment:
Both methods require that we can measure or calculate the 3D vectors in space to the target centers. Method 1 uses the GPS Vectors directly measured using Survey grade GNSS receivers. Method 2 uses the calculated vectors predicted by the Globe and Flat Earth Computer Model .
A third method would be Measuring Refraction from Observations with a theodolite. This was not done in this Experiment, but I will describe how it could be done anyway.
Measuring Refraction from GPS Vectors
The GPS Vectors to the target centers were directly measured using Survey grade GNSS receivers. They represent the real geometrical positions in space, not dependent on refraction, perspective or the model of the earth.
The following screenshots show the overlay of photos of the Bedford and Tangent targets with the corresponding GPS Vectors in the GNSS Data Viewer. The photos are taken through the auto level. The virtual camera of the Viewer was set to the observer locations and the zoom and viewing direction was adjusted to match the vertical positions of the nearest target centers and the horizontal positions of all targets.
 Img 23: Overlay GPS Vectors with image of Bedford targets → App
 Img 24: Overlay GPS Vectors with image of Tangent targets → App
The white markers show the positions the GPS Vectors are pointing to and can be used as a reference. The apparent lift of the targets is due to refraction and can be measured from the image.
Note: The equations for the refraction Coefficient (9) and (10) can be used for any shape of the earth. The factor R is only present because the refraction Coefficient k is defined as the curvature of the light rays times R. The curvature of a light ray itself is independent of the shape of the earth.
Note: Use positive values for l if the image appears higher than the GPS Vectors and negative values if the image appears lower than the GPS Vectors.
Bedford Target Refraction: The apparent lift of the Bedford target (5) at 5.4 km distance is about 0.5 m, estimated from the 0.9 m target plate vertical size. Applying formula (8) results in a refraction of:
| (9) |
|
Tangent Target Refraction: The apparent lift of the Tangent target (7) at 9.5 km distance is about 1 m, estimated from the 1.6 m target plate vertical size. Applying formula (8) results in a refraction of:
| (10) |
|
The measured refraction at the Bedford targets from 1.85 m observer height was slightly higher than at the Tangent targets from 3.91 m observer height, which is consistent with what atmospheric refraction predicts.
The markers in the Viewer were aligned exactly to the vertical positions of the first target centers, but in reality this targets were also affected by refraction and should appear slightly above this markers. Therefore this refraction calculations results in slightly too small values: 0.05 smaller than compared with Measuring Refraction with the Computer Model.
The GPS Vectors clearly show the earth is not flat.
Measuring Refraction with the Computer Model
We can use the Computer Model to measure refraction from an image as follows:
We import an image of the Bedford or Tangent targets into the Computer Model, set the observer height accordingly, set the zoom to match the zoom of the image and pan the model camera into the direction the real camera was aimed. We have to use the simulation of the Globe Model to measure refraction, because refraction is not simulated for the Flat Earth Model. But we can calculate refraction for the Flat Earth Model from the values obtained with the Globe Model.
With zero refraction set in the Computer Model, all targets on the images will appear too high and can not be matched with the image by tilting the model camera. But when we apply refraction with the Refraction slider, we can make the computer graphics match the images perfectly. We can then read off the refraction Coefficient k from the Computer Model:
- Results for Bedford Targets: k = 0.270
- Second Result for Tangent Targets: k = 0.187
Flat Earth Refraction from Globe Refraction
The corresponding refraction Coefficient of the Flat Earth Model can be calculated from the refraction value k of the Globe Model as follows:
| (11) |
|
Explanation: If refraction k = 0 is set on the Globe Model, the earth appears like a globe with radius 6371 km. In reality the Flat Earth would appear as such a globe if light is bent upwards with a radius of curvature of 6371 km. This light ray curvature corresponds to a refraction Coefficient of −1: so kFE = k − 1 = 0 − 1.
On the other hand, if refraction k = 1 is set on the Globe Model, the earth appears flat, because at refraction k = 1 light rays get bent down with a radius of curvature of 6371 km. In reality the Flat Earth would appear flat if refraction is zero: so kFE = k − 1 = 1 − 1.
This correlation between kFE and k is only valid for k < 1 respectively kFE < 0, where we have a distinct horizon. In other circumstances we have to execute the Calculations without a Horizon.
So the measured Flat Earth refraction Coefficients from the Computer Model are:
- Result for Bedford Targets: kFE = 0.270 − 1 = −0.730
- Result for Tangent Targets: kFE = 0.187 − 1 = −0.813
As explained at Refraction Range of Clear Images such high negative refractions would cause very distorted images. We don't see distortions in the used images and this values are not consistent with the values obtained at Measuring Refraction from GPS Vectors.
This results show, the earth can not be flat.
Measuring Refraction from Observations
We can calculate refraction from real world observations. First we calculate the expected drop of the horizon or a target without refraction for the Globe and Flat Earth model. Then we measure the effective drop with a theodolite. From the difference of the expectation and the measurement we can calculate the refraction Coefficients for both models.
To calculate the expected horizon drop x and drop angle φ without refraction, depending on the observer height h, for the Globe we can use the following good approximations. Note, we use positive signs for drops below eye level:
| (12) |
|
| ||||||||||||
| source | ||||||||||||||
| where' |
| |||||||||||||
The expected horizon drop and drop angle of the Flat Earth model is simply 0.
| (13) |
|
| ||||||
| where' |
| |||||||
Now we measure the real horizon drop xreal or drop angle φreal with a theodolite. If we measure the drop angle φreal we have to convert it into the drop distance xreal using the following equation. Note, we use positive signs for drops below eye level:
| (14) |
|
| ||||||||||||
| source |
| |||||||||||||
| (15) |
|
good approximation | ||||||||||||
| source |
| |||||||||||||
| where' |
| |||||||||||||
Now we calculate the apparent lift from the differences between expectation and measurement. Note, we use positive signs for drops below eye level:
| (16) |
|
| |||
| where' |
| ||||
Now we can calculate the refraction Coefficients for Flat Earth and Globe model using the same equation for both models, beacuse the curvature of the light rays over distances not much more than 10 km is identical for all practical purposes for both models, see Refracted Light Rays on Globe and Flat Earth:
| (17) |
|
| ||||||||||||||||||
| where' |
| |||||||||||||||||||
This method only works if there is an unobstructed and distinct horizon, which is not always the case, see Horizon above Eye Level. If there is no distinct horizon, you have to use the Calculations without a Horizon.
If the calculated refraction value lies within the Refraction Range of Clear Images, the image will look clear. Outside this range it will look distorted. If we have a clear image and the calculated refraction Coefficient for one of the models lies outside the range for clear images, then this model does not fulfill the prediction and is falsified.
Calculations without a Horizon
If we don't have a distinct horizon, we have to use another target with a known height and distance to calculate its position with respect to eye level for zero refraction. For the Globe model we can use the following equation. We use positive values for drops below eye level:
| (18) |
|
| ||||||||||||||||||
| source | ||||||||||||||||||||
| where' |
| |||||||||||||||||||
For the Flat Earth Model we can use:
| (19) |
|
|
We can then measure the raise or drop of the target with respect to eye level with a theodolite. The remaining calculations are the same as described at Measuring Refraction from Observations with a distinct horizon.
Strong Refraction
Lets look whether we can determine the shape of the earth from images with strong refraction. To do so we first have to investigate how strong refraction influences an image.
The biggest influence on atmospheric refraction has the temperature gradient dT/dh (change in temperature in a certain change of altitude). On standard atmospheric conditions below 11 km altitude the temperature gradient according to the International Standard Atmosphere is constant −0.0065°C/m, which results in a refraction Coefficient at sea level of k = 0.17, called Standard Refraction.
Distorted images are caused by turbulent air. Turbulent air is caused by temperature gradients that diverge from standard. So distorted images are always a sign of strong refraction. In fact, there are devices that measure refraction by analysing the turbulence of the air in images [3] [4]. On the other hand, a clear image is a sign of a temperature gradient near standard which causes low refraction. But note, low refraction is not zero refraction. Because the air density is always decreasing with increasing altitude, even on calm air conditions there is always some standard refraction.
Refraction Range of Clear Images
The following table lists some refraction values and tells how the earth (flat and globe) is expected to look like according to the Accepted Model of Atmospheric Refraction:
| Refraction | dT/dh [°C/m] | Image | Flat Earth appearance | Globe appearance |
|---|---|---|---|---|
| k = −1 | −0.20 | distorted | globe with R = 6371 km horizon below eye level | globe with R = 3185 km horizon below eye level |
| k = −0.83..0 | −0.17..−0.034 | distorted | globe R > 7682 km to flat horizon below eye level | globe R = 3481..6371 km horizon below eye level |
| k = 0 | −0.034 | clear | flat horizon at eye level | globe R = 6371 km horizon below eye level |
| k = 0.17 standard | −0.0065 standard | clear | concave horizon above eye level | globe R = 7682 km horizon below eye level |
| k = 0..0.3 | −0.034..0.015 | clear | flat..concave horizon above eye level | globe R = 6371..9101 km horizon below eye level |
| k = 0.3..1 | 0.015..0.13 | distorted | concave horizon way above eye level | globe..flat R > 9101 km horizon below eye level |
| k = 1 | 0.13 | distorted | concave horizon way above eye level | flat horizon at eye level |
| k = 1..2 | 0.13..0.29 | distorted | concave horizon way above eye level | flat..concave horizon above eye level |
| k > 2 | > 0.29 | distorted | concave horizon way, way above eye level | concave horizon way above eye level |
The following graph shows the correlation between the refraction Coefficient and the predicted horizon position with respect to eye level for the Flat Earth and Globe model.
This graph is not accurate, but shows the point for the following discussion. The real correlation between refraction and horizon drop is not linear. The slope of the horizon lines depends on the observer height, but the Globe Horizon must cross eye level at k = 1 and the Flat Earth Horizon must cross eye level at k = 0 and the lines are parallel.
The refraction range producing clear images is shown with a blue background. This range depends partially on the observed distance. Near objects appear less distorted than far objects. Here is the approximate range shown for the 10 km observing distance of the Rainy Lake Experiment.

We can see that for a certain horizon drop the refraction Coefficient of the Flat Earth model is kFE = kGlobe − 1, at least for k values less than 1, as explained at Flat Earth Refraction from Globe Refraction.
If refraction is 0 then the Flat Eearth horizon is at eye level, while the drop for the Globe corresponds to a sphere with radius 6371 km. If refraction is 1, the Globe horizon is at eye level, the Globe looks flat, while the Flat Earth will appear concave. For a Flat Earth to appear as a globe with radius 6371 km, refraction has to be −1. Such conditions can only occur over hot ground and are confined to low altitudes over ground. The corresponding images will look very distorted, because the temperature gradient for such refractions causes turbulent air.
Strong Refraction at Bedford Targets
If refraction gets greater than 1, even on the Globe the horizon raises above eye level and the earth appears concave shaped. An observation of refraction greater than 1 is shown in image 28. You can tell that there is strong refraction because the image looks very distorted and the corresponding video shows a very instable scene.
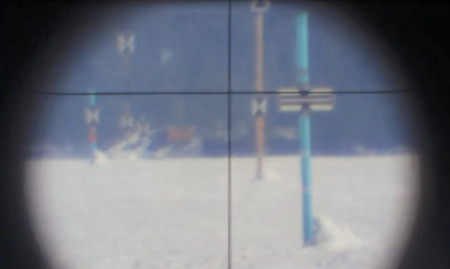

Note: Eye level on both images is where the horizontal crosshair is, not at the center of the image! Both imagages are taken from 1.85 m observer height through an auto level.
Globe Model: According to Refraction Range of Clear Images refraction in image 27 is low, about standard, because the horizon is below eye level and the image is clear. Refraction on image 28 is strong because the image is distorted. The horizon is above eye level, which means refraction is greater than 1. Both images are consistent with the predictions of atmospheric refraction on the Globe model.
Flat Earth Model: Measuring Refraction from Observations for the Flat Earth gives for image 28 a refraction coefficient greater than 1. According to Refraction Range of Clear Images it is expected that such an image on the Flat Earth will look very distroted. This is the case, so this image supports the Flat Earth model. But in image 27 the refraction calculated for the Flat Earth model is strong negative, because the horizon appears way below eye level. According to Refraction Range of Clear Images this image should look very distorted, but it looks clear. This means the assumption of a Flat Earth is not consistent with this observation.
Images of the Bedford targets with strong refraction are not consistent with the Flat Earth model.
Calculations
Although the apparent lifting of the horizon may appear unbelievable strong here, keep in mind, we are looking through an auto level with high magnification. The refraction angle on standard refraction to the horizon at the farthest target at 9.5 km distance is only ρ = 0.0072°, see formula (7). The lift of the horizon on image 28 compared to image 27 is about 15 m, which corresponds to a refraction Coefficient of k = 2.1, see formula (8). The refraction angle at this refraction is still less than ρ = 0.09°. But this is enough to raise the horizon 9 m way above eye level! The earth appears concave.
Laser Tests
Refraction always fades to standard with increasing altitude. When you look over a surface, light gets influenced the most as it approaches the surface. At least parts of the light rays from objects behind the horizon always streak the horizon where refraction is the strongest. In looming conditions, where refraction is greater than standard, images appear increasingly compressed near the surface, because refraction there is strongest and lifts up the lower parts of objects more than the upper parts.
If refraction directly over the surface is greater than 1, which is very often the case on looming conditions, light rays streaking the surface can follow the curvature of the earth for hundreds of km. Shooting a laser great distances over water or ice is a bad idea to measure curvature, because there are always light rays streaking the surface, which then can bee seen in any distance until they get absorbed by the atmosphere.
It is obvious that in conditions like in image 28 a Laser placed on the ground at 10 km distance or more would be visible from the ground at the observer. Image 28 was taken before dawn, when the air was still warm but the ground was cold. This can cause strong refractions of k > 1.
After sunset, when the ground is cooling faster than the air above, near the ground you can easily get refraction coefficients way beyond 1. [2] Flat earthers alway conduct their laser test very near the ground after sunset over cool water or ice. In such conditions it is expected to see a laser over any distance. Such experiments to prove the earth is flat are flawed, as the Rainy Lake Experiment shows.
Strong Refraction at Tangent Targets
Here are some images from the Time lapse of Refraction that show that strong refraction at higher elevation is not as strong as on lower elevation, but still can raise targets in the distance considerably.


- Time lapse at 13 s
- at 16 s
- at 20 s
- at 28 s
- at 38 s
- at 39 s
We can recognize strong refraction in images, because images look distorted on strong refraction. So on the first images refraction is low, while on the last images it is high. The effect is even better visible on a Time lapse of Refraction during a day.
Lets analyse refraction from the first and last image for the Flat Earth and Globe model.


Globe Model: According to Refraction Range of Clear Images refraction in image 31 is low, about standard, because the horizon is below eye level and the image is clear. Refraction on image 32 is strong because the image is distorted. On both images the horizon is below eye level, which means refraction is less than 1 on both images. Both images are consistent with the predictions of atmospheric refraction for the Globe model.
Flat Earth Model: Because the horizon in both images is below eye level, according to the graph at Refraction Range of Clear Images, the corresponding refraction Coefficients in both images must be negative for the Flat Earth model. Refraction in image 31 must be more negative than in image 32, because the horizon appears lower in image 31. As image 32 with less negative refraction than image 31 already appears very distorted, image 31 should appear even more distorted. But image 31 appears very clear. This means the assumption of a Flat Earth is not consistent with this observation.
From the distortions of the images can be concluded, that refraction must be in the range from standard refraction to refraction k < 1. In this refraction range on the Globe model the horizon will appear always below eye level. This is consistent with observation. On the Flat Earth model the horizon in this refraction range would always appear above eye level, which is inconsistent with observation.
Images of the Tangent targets with strong refraction are not consistent with the Flat Earth model.
Calculations
The apparent lift of the Tangent target (7) between the first and last image is estimated from the target size of 1.6 m to about 2.9 m. This corresponds according to formula (8) to a refraction difference of k = 0.23. The measured refraction Coefficient for the Globe model of the first image is k = 0.18. So the refraction Coefficient of the last image is k = 0.18 + 0.23 = 0.41.
The strongest observed refraction at the Bedford targets with an observer height of 1.85 m (image 28) was about k = 2.1. The strongest observed refraction at the Tangent targets with an observer height of 3.91 m (image 32) was about k = 0.41. This is consistent with the prediction that refraction near the surface is usually stronger than higher up.
Time lapse of Refraction
Video Rainy Lake Time Lapse Stabilized and Cropped 2018-04-01 by Soundly.
The camera was at a height of about 4 m above water level next to the auto level, which is at the level of the Tangent targets. Note how refraction gets stronger and stronger towards the evening as the ground cools down faster than the air above, creating a strong negative density gradient directly above the surface, which bends light down and looms up the horizon and the targets. You can see how the horizon and the targets get lifted more and more and the images get more distorted. The horizon appears lifted about 2.9 m at the end.
References
The refractive index or index of refraction of a material is a dimensionless number that describes how fast light propagates through the material.
https://en.wikipedia.org/wiki/Refractive%5Findex
Variation of the Refraktion Coefficient near the Ground; Terrestrial Refraktion in Astronomic Navigation
https://de.wikipedia.org/wiki/Terrestrische_Refraktion
Keywords: Refraction, dispersometry, scintillometry, temperature gradient
https://www.fig.net/resources/proceedings/fig_proceedings/fig_2002/Js28/JS28_ingensand.pdf
Study presents a method for the determination of the influence of refraction on the basis of optical measurements.
https://geodaesie.info/sites/default/files/privat/zfv_2012_3_Reiterer.pdf
This paper shows that near the surface refraction can vary from -3 to 16 during the day. As the surface is heated by the sun, refraction is negative. As the surface cools refraction is positive, much greater than 1 after sunset.
http://onlinelibrary.wiley.com/doi/10.1029/2010JD014067/abstract;jsessionid=929EF8B10D42832FBFFA1D197CBAC3CB.f02t01